HOW AN ADC WORKS
with very large analog signal variations
| This page is an explanation and demonstration of the
operation of an ADC with a large variation, analog signal. I am
using a seismograph because of the huge variation in analog
signal levels which can change as much as
10,000%. As a real example, I am using a seismograph of a Napa aftershock from the large magnitude 6.1 earthquake. This aftershock is magnitude 3.2 and occurred near Napa California at 8:56 UTC (1:56 AM PST) on August 31, 2014. The change in analog voltage to the ADC between the 1.9 and 3.2 examples below is about 1800% This chart below is part of a series of charts on this page which will help to illustrate the real value of a 24 bit ADC and its ability to resolve extreme detail in very small and very large analog events. This is a difficult description and a complicated point but I will continue to edit this section until it makes the best sense I can put in writing. Closing this example window will not close the previous main article on general applications of the 24 bit ADC. |
The essential issue made on this page is that the 24 bit ADC can resolve and show very small analog events and very large analog events all in the same data.
This illustration (this section) uses earthquake information as a process to show very good resolution of two different sets of data, one set from a fairly small earthquake and one set of data from a fairly large earthquake.
Earthquakes are measured in terms of a word called Magnitude. An earthquake magnitude is measurement of earthquake intensity and it is on a logarithmic scale. Logarithmic here means that a Magnitude 2 it 10 times the intensity of Magnitude 1. From this point on I will refer to Magnitude one as M 1, Magnitude M 2, etc.
In this example I will use an M 2 and an M 3 as comparisons. I am suing these because I happen to have a data page - a chart - that has both on the same page. That data page is here:
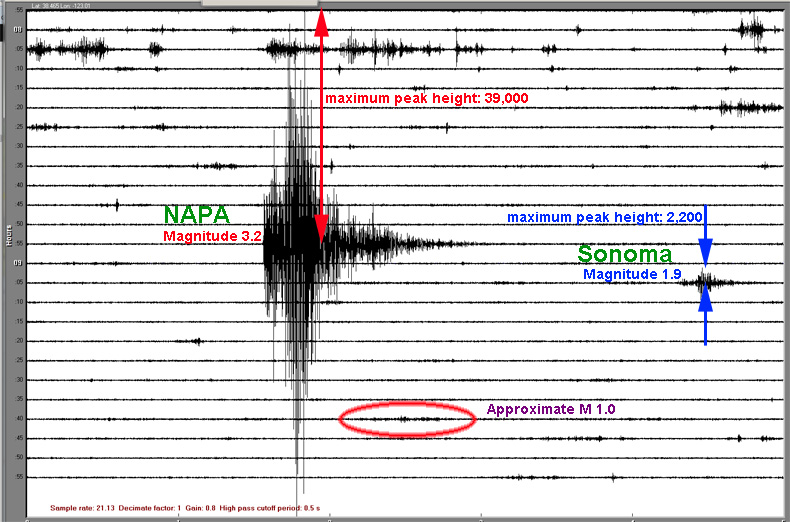
As you can see, even in a raw data format, the two events are very different in size. But the essential point I would like to make here is that both events can be clearly detailed as shown below in images of each event that give full detailed resolution even with a 1000 % difference ( x 10) in analog voltage as a source.
The problem with seismology is that magnitudes vary from sub M 1 (micro earthquakes) to M 6 as I just experienced in the Napa 6.1 45 miles from my house and seismograph. M 1 compared to M 6 is a 1,000,000 x range in analog sensor voltage which is linear. Said slightly differently, an M 6 event has 1,000,000 time the analog voltage output as a M 1 has.
This is actually not possible, even with a 24 bit seismograph. It is clear that a reasonable range must be set. I have set my seismograph to see and resolve events from M 1 to M 4. that is a 10,000 x range in voltage or 1,000,000 %. The good news is that earthquake energy dissipates rapidly with distance. As an illustration, a M 2 near me (45 miles) is approximately like an M 7, five hundred miles away. This distance approximation is based on measurements I have made of close events here in Northern California and in Los Angeles 500 miles away in southern California. The great variable in this calculation is what types of materials, including water, soft sediments, and rock are between the seismograph and the event.
ADC Setup
Since the seismograph ADC can be setup with any input voltage scaling needed, it is necessary to calibrate the input voltage to the ADC for each end (max and min voltage to the ADC) of the analog voltage expected. I have set my seismograph ADC for the minimum voltage to be 4 times the circuit noise (about 60 microvolts) fro an m 1 up to 4 volts for a M 4 event. To set this range, I have a preamp with a gain of 1000.
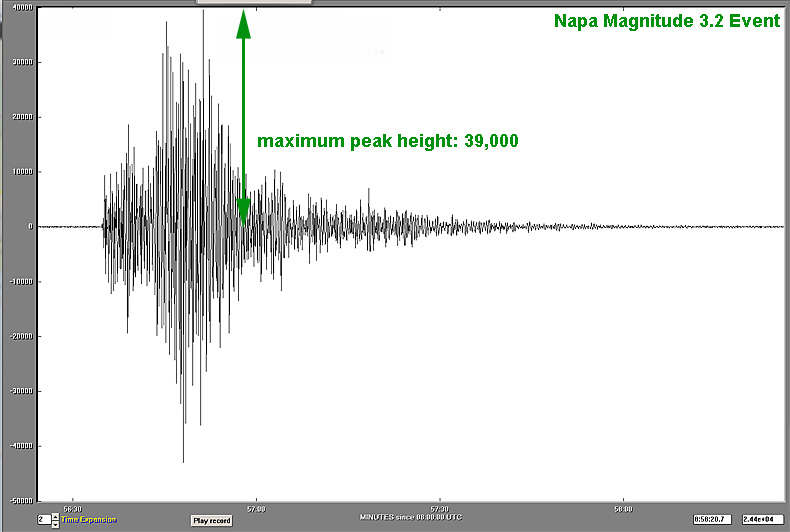
The Napa M 3.2 event below was about 4 volts into my ADC.
(+/- 40,000 counts max and min chart scale)
NAPA - MAGNITUDE 3.2, AFTERSHOCK (from a M 6.1 a few days earlier)
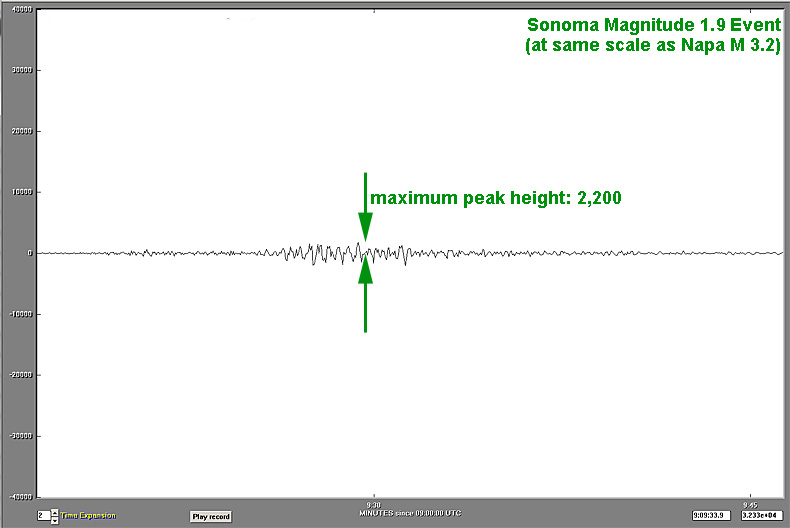
This Sonoma earthquake below is show on the same scale as the 3.2 earth quake above. It is clear that the detail is poor. But the actual data is quite good because of the 24 bit ADC range. The image below this image is a detail view of the Sonoma M 1.9 quake. The only difference between the two images below is in the scale of the chart!!
SONOMA magnitude 1.9 event on same scale as the magnitude 3.2 Napa event above (+/- 40,000 counts max and min chart scale)
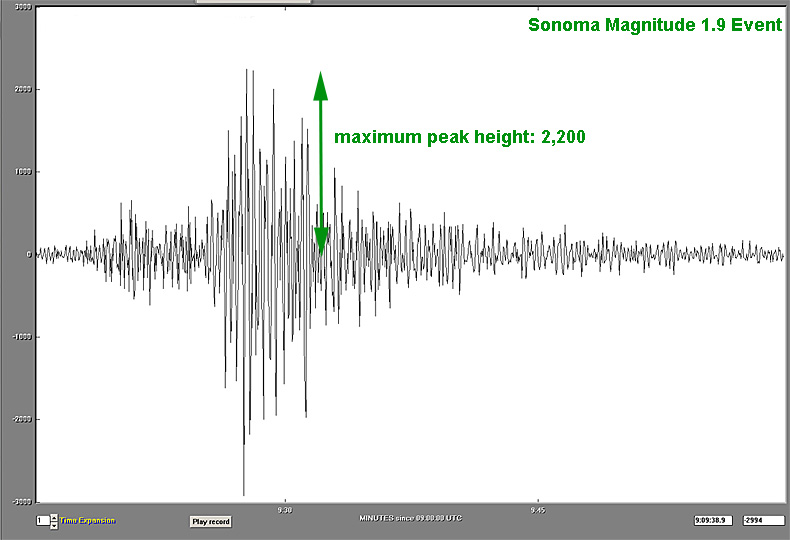
The image below is at a scale of zero to +/- 3000 and shows the amazing detail that is really in the data.
This amount of data in the image below when capturing the 3.2 data equally well is only possible with a 24 bit ADC.
There is a huge amount of data to back up my statement but it is to much information for this paper. I could reference many other dual events but my point has been illustrated and anyone interested in commenting should write to me - I will gladly consider edits and questions on this page - I realize it is controversial and difficult to explain this ability of an ADC and I have done my best.
SONOMA magnitude 1.9 event above on expanded detail scale (+/- 3000 counts max and min chart scale)
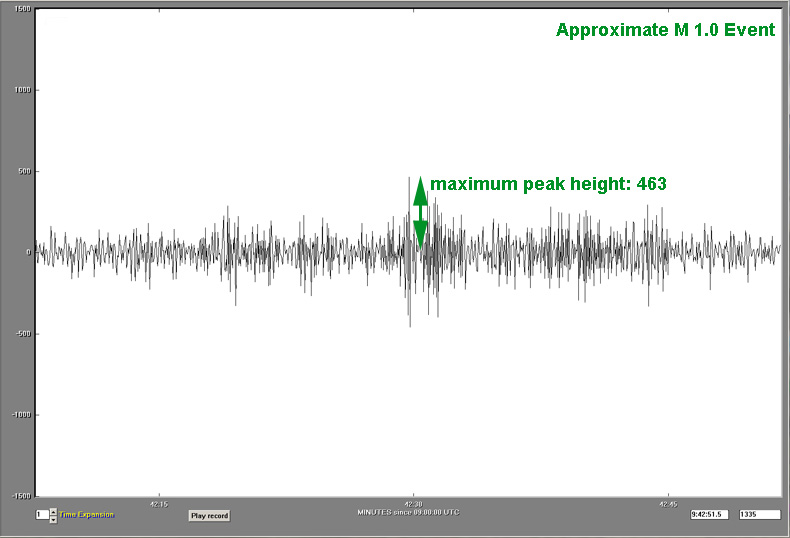
For those of you who are curious, the image below is a typical M 1 event. This group of peaks is just above the system noise level which is +/- 25 counts. At the time this image was captured, my system was on a high sensitivity setting which can be set in the Arduino code. At night, the system noise, even at high sensitivity is about +/- 25 counts on the AmaSeis chart. I do have noise wave forms of the noise from this chart but it seems like to much information to place on this page.
For the math, physics, and electronic people, the signal to noise ratio (S/N), proven to date, is 40,000/25 or 1600. This is one part noise to 1600 parts signal. A lot of the noise you see below is miscellaneous magnetic activity including very small seismic events but the apparent noise also includes ocean surf activity and other natural noise sources combined with cultural noise such as , aircraft , cars, trucks, etc. Magnetic seismic events below M 1 are extremely difficult to separate from random noise but may be very important to understanding local seismic and volcanic activity.
If you have comments or corrections to suggest for this page, please contact me through my "Contact Me" page.
This set of images on this page is in a new window - closing this window will NOT close the main paper on the 24 bit ADC.
If this button below does not work, close the window by clicking on the red X in the upper right corner of this window. The main ADC page is separate and will still be there.