Seismology and the 24 bit ADC

Ultra High Gain Possibilities


For a general technical information discussion including code and schematics in the application of the LTC2440 ADC
please visit this page: 

 http://www.steveluce.com/24bits/Applications of the LTC 24 bit ADC.html


This seismology page is being revised -  it will be changing over the next month or two.

I am looking for a way to show a complete event and 1900 pixel monitors are not a good way

to see a major seismograph in detail.

Some links will not work until I get this page format redesigned 

RECENT NOTABLE EVENTS FROM MY SEISMOGRAPH'S POINT OF VIEW (Located in Monte Rio California - about 50 miles north of San Francisco)


                   BEGIN RECENT SELECTED EXAMPLES OF EARTHQUAKES

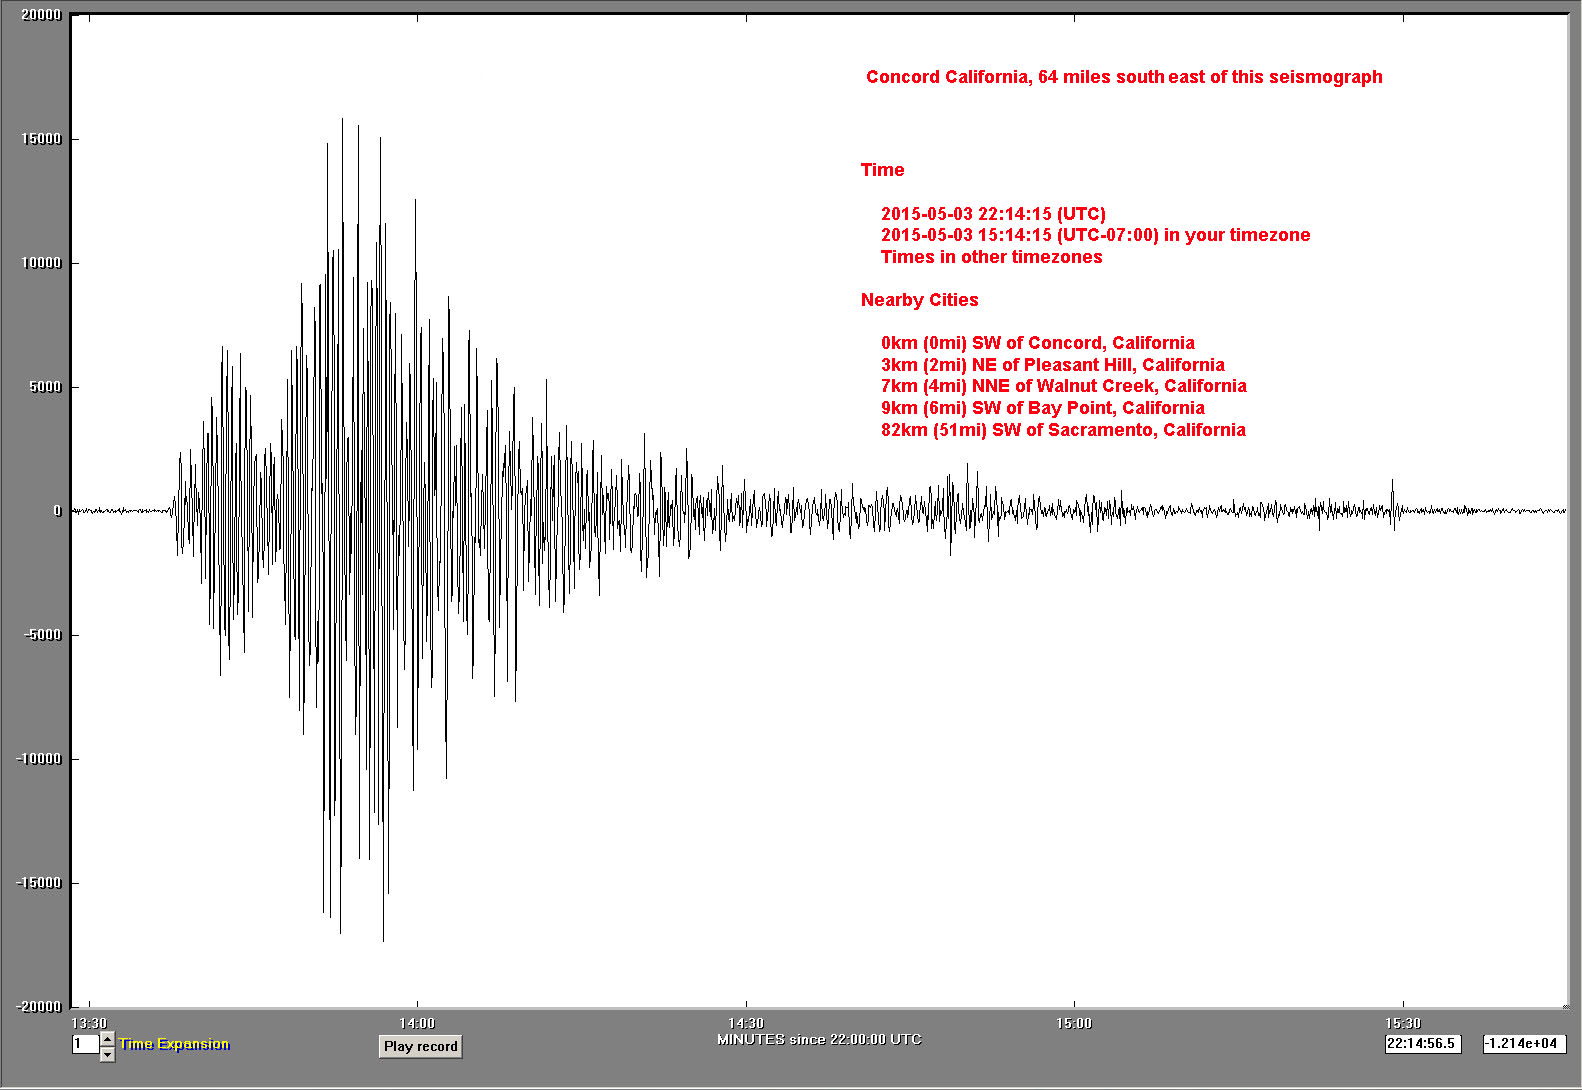
Concord California
M 4.0
3 May, 2015

64 miles south east of this seismograph

Concord CA 4.0 earth quake 3 May 2015

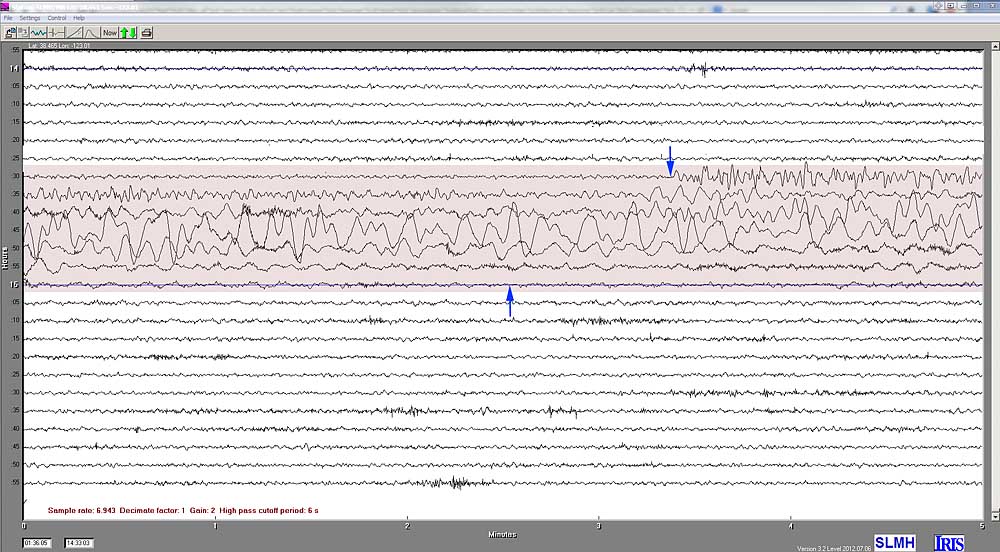
FERNDALE, CALIFORNIA

M 5.7

28 JAN 2015

160 miles (258 meters) north of my seismograph 
Move the bottom  right-left slide bar on your browser to see the entire trace - this is image is 3800 pixels wide and more than 20 minutes (minimum) of activity.

Ferndale M 5.7

Move the bottom  right-left slide bar on your browser  [BELOW]  to see the entire trace - this is image is 3800 pixels wide and more than 20 minutes (minimum) of activity.


GREENFIELD M 4.4
20 JAN, 2015
170
miles (270 meters) south east of my seismograph

Greenfield


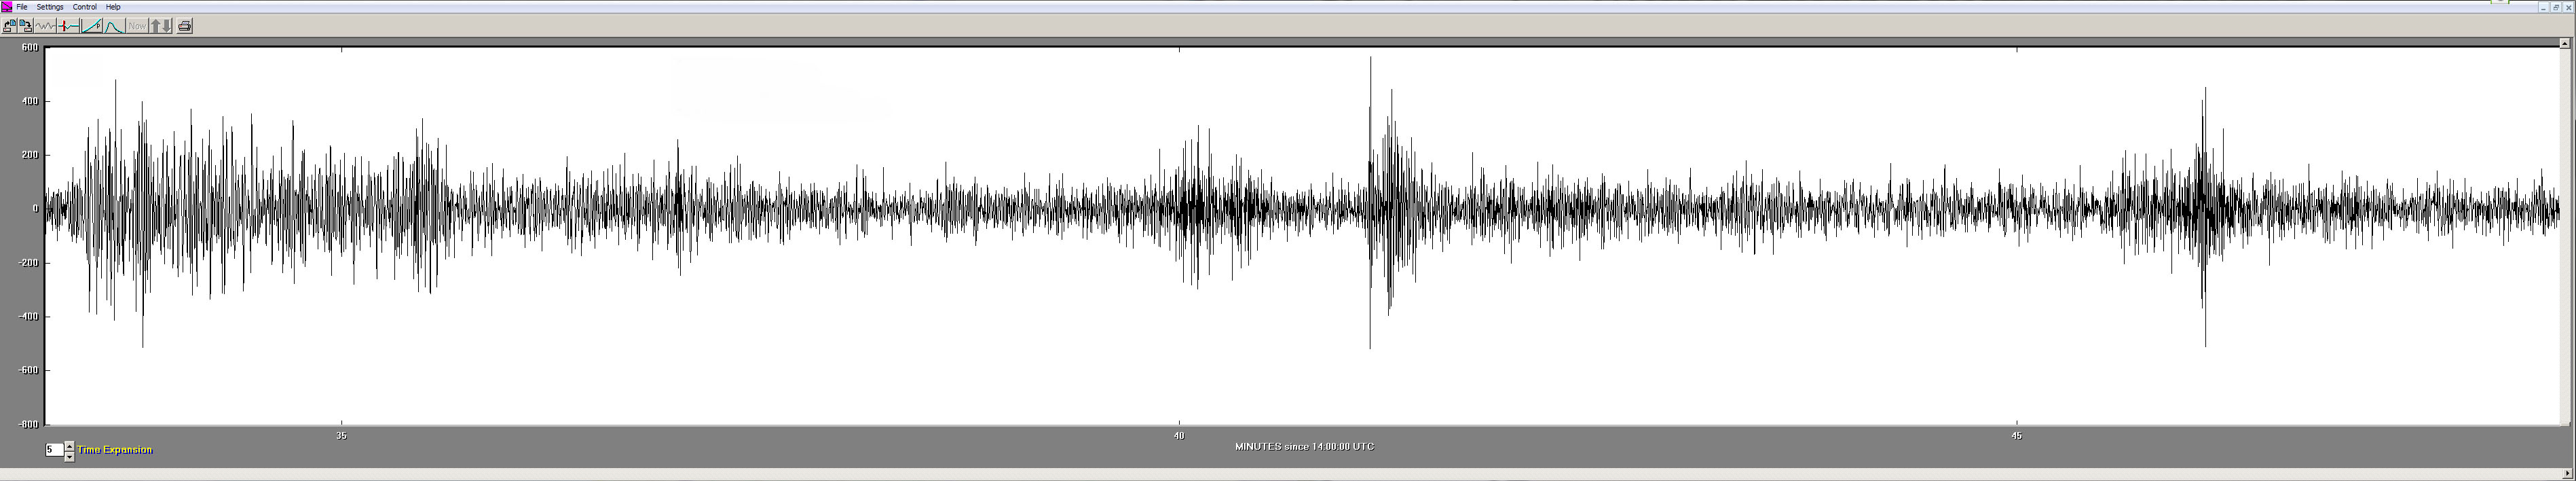
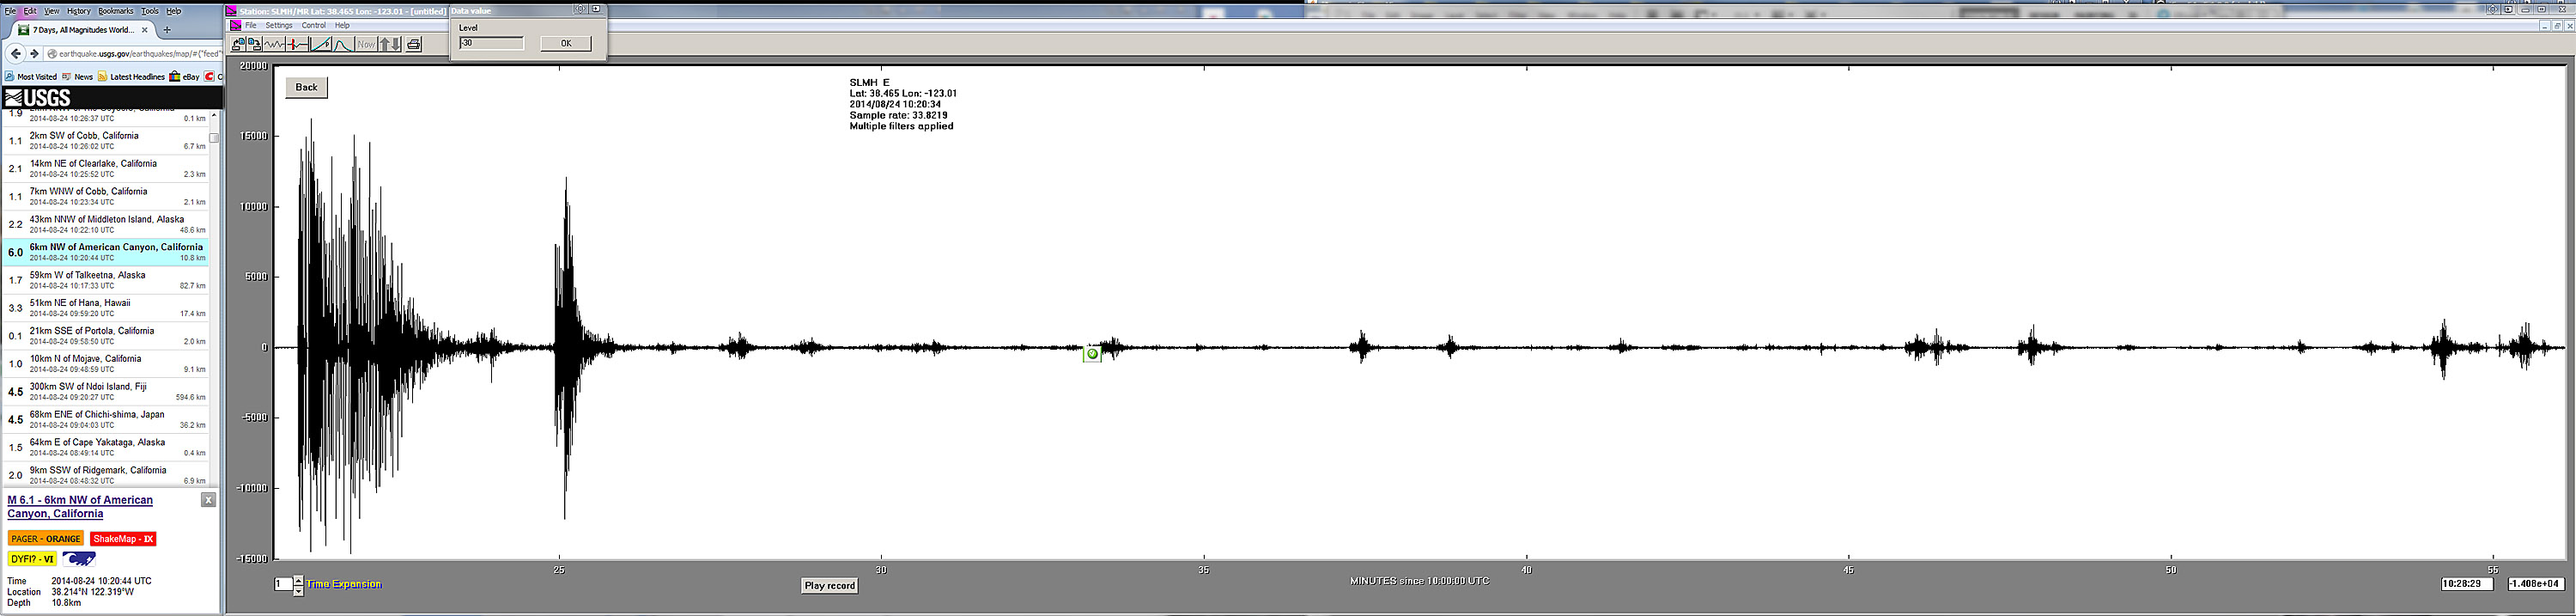
M 6.1, Napa Valley Area

40  MILES (53 meters) south east of my seismograph 

The is an M 6.1 in our area (the San Francisco Bay Area, just south of Napa Valley ) at 10:20:44 UTC on August 24, 2014.
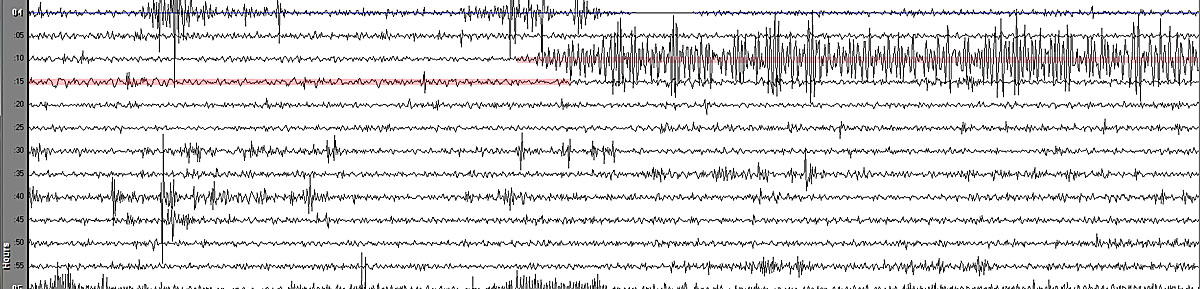

Napa Valley M 6.1 Event 8/24/14


This image above is two screens wide...please use your browser's, bottom slide bar
to see the entire image

NAPA AFTER SHOCK

40 (53 meters) south east of my seismograph 

The image below is one of the larger aftershocks from the M 6.1 American Canyon (Napa) event. Please use your browser, bottom slide bar, to see the entire image.
This aftershock is about 2 hours after the M 6.1 event.

Napa 6.0 earthquake seismograph - aftershock example

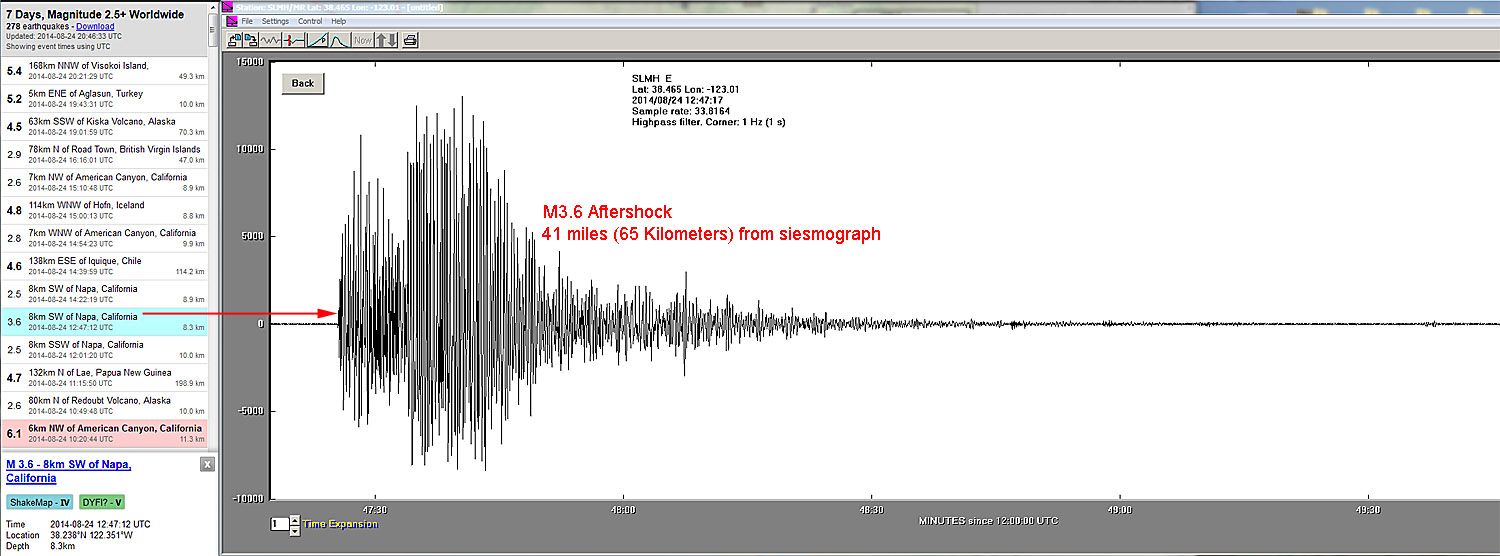
This image is two screens wide...please use your bottom browser slide bar below,

to see the entire image


NAPA RAW DATA ON AMASEIS SCREEN
40 (53 meters) south east of my seismograph 


Napa M 6.1 event - raw data screen


                                             END RECENT EARTHQUAKE LIST


BACK TO THIS WEBSITE AND ITS GENERAL PURPOSE


On this page you will find...


Specific applications of the LTC2440 to Seismology

This page is dedicated to the use of the 24 bit ADC in Seismology. There are seismograph mechanical drawings, actual sample seismographs and limited information on the details of the LTC2440 circuit. If you are interested in seismographs please stay on this page.

The seismograph page is below


On a separate page you will find...


General applications of the LTC2440 with specific code and schematics to get the LTC2440 started

If you interested in the general use of the 24 bit LTC2400 and the LTC2440, I have developed a second page that covers the electronics, processor, and code in great detail. It is a page that lists various ADC circuits, applications, circuit construction, component suggestions, processor explanation, and processor code. This electronics page is the general application of the LTC2440 and a few sample applications such as a 6 place volt meter, the use of weather sensors, etc. The page also discusses other subjects such as high gain noise, circuit construction, working with gains of up to one million, and what it will take to get to 21 bits (one part in 2 million) with a 24 bit ADC.

This is a detailed electronics, processor, and code page.

And of course you can move back and forth as you please.

To the electronics page: LTC2440 APPLICATIONS, SCHEMATICS, AND CODING


WELCOME TO THE SEISMOLOGY PAGE


 TABLE OF CONTENTS OF THIS PAGE

   INTRODUCTION AND SYSTEM BLOCK DIAGRAM   - An introduction to this page, seismograph construction and 24 bit ADCs.

SEISMOGRAPH DRAWING WITH COMMENTS - A basic drawings of my present seismographs on which I am testing the ADC electronics.

SEISMOGRAPH EXAMPLES - A collection of sample seismographs captured over the past two weeks including local and long distance events.

SEISMOGRAPH CIRCUIT DESCRIPTION - A quick description of the electronics and why each component was chosen.

SEISMOGRAPH SCHEMATIC - A complete schematic of the latest version of the electronics - but subject to change almost daily.

REFERENCE MATERIAL - some of my source information.

SEPARATE PAGE: MOST RECENT SEISMOGRAPHS ON A SEPARATE SEISMOGRAPH PAGE - This new page is intended to be a running record of new, large or unusual events both local and distant. I am in the process of making a comparison between my horizontal system and the TC-1 vertical seismograph looking at the same event. This additional example page is is just getting started.


Other Subjects of Interest

A few other subjects to be discussed on this page...

I will review my construction issues and solutions but will also go into some area of controversy including  "coil shunt resistors" used in the damping process.

Shunt coil damping is extremely useful but technically not quite understood by the general seismology community. I found the process easy enough to experiment with in the use of resistors but very difficult to understand. I also found I could get a better impedance match with my op amps and even have an effect on circuit noise levels - both up and down depending on the value of the resistor. The "New Caledonia" event on the "latest seismic events" page, mentioned in the section to the right of this text area is captured with a shunt coil damper and NO magnetic damping.

Another complex issue it the selection of an op amp set for pre-amplification of the coil output - which is more important - temperature stability with low noise or ultra low noise with a mild temperature drift?

If the seismograph is to be placed outside, extremely temperature stable chopper op amps may be the best choice because they can show very little change over a 150 C temperature range. Still another area of interest is the pre and post processing of the event signal. This is an area I will be experimenting with using software filters in  place of hardwired filters which permanently and irreversibly change

  the data if the filters are hard wired into the pre-amp board. The one exception to this may be antialiasing filtering if it seems critical.

This problem is especially important if a person would like to examine "tremors" or pre-quake volcanic activity where the tremors can be as high in frequency as 100 CPS.

There are a few notable seismic events at the bottom of this page. This set of seismographs are simply a representation of my seismograph collection to date. If you have been to this page before and you are just interested in the latest seismographs generally after May 1, 2014,

I have recorded and placed the newest large or unusual seismic events on a special page.

This page is a collection of my latest recordings and are, at least to me, special for some reason. These are generally done from a "Print Screen" of AmaSeis or jAmaseis and captured by Photoshop where I clean up the Print screen image and size the image appropriately. The image detail is not changed in any way, the phrase "clean up" refers to excess detail like screen icons, local time, etc., not needed in the seismic event image. This is a collection of latest images, recorded after May 1, 2014, and the content of the page changes from day to day. The images can be seen by selecting the page or events below.

LATEST SAMPLE SEISMIC EVENTS LATEST  SEISMIC EVENTS PAGE PAGE

M6.6 - 201km WNW of Ile Hunter, New Caledonia 2014-05-01 06:36:35 UTC

A comparison of horizontal and vertical seismographs on the same event is in preparation.


Introduction

I am extremely grateful for help I received from professionals in the seismology and geophysics area who have helped me develop my seismograph. My very modest background in the areas of science used in seismology wore out a few friendships but I am so happy to have had their help - thank you!     

I have been working with several ideas that can apply modern technologies to very standard seismographs. The basic model of seismograph I am using for a base test model is a variation on the Lehman "garden gate" seismograph. But much of my work, especially with high performance electronics, is applicable to most seismographs and can easily be substituted for present, less sensitive, electronics in existing seismograph electronics.

One goal of this project is to keep costs down and to put the project within reach of people with a modest but modern technology understanding. I am hoping that the total cost of this circuit from preamp to processor will be less than $200.

The heart of my sensor to signal system is the use of the Linear Technologies LTC2440 differential input, ultra low noise, high speed 24 bit ADC. The LTC2440 can sample any signal up to plus or minus five volts at any rate from 7 samples per second (SPS) up to 880 SPS even though the ADC is single ended. It is important to understand that this ADC output signal can be up to plus or minus 5 volts and both the plus and minus values are given as 24 bit plus or minus ASCII numbers and zero volts is the center value.

I am presently running my LTC2440 at 880 SPS with a software average routine that averages 44 samples at a time giving me an output sample rate of 20 samples per second (880/44 -> 22 SPS). My maximum sample rate is 880 SPS.

The major problem with very high sample rates is the limitation of most modern screen display systems which often collect data at a 9600 BAUD rate.  

The wiring of the LTC2440 can be complex but has been simplified by myself and John Beale. Beale developed some of the original microprocessor coding that makes the use of the LTC2440 very simple and easily accessible to the amateur or professional who is not microprocessor oriented. In my work, I have used a very simple processor call the Arduino Uno*, but any reasonable equivalent processor can be used. The main purpose for the processor is to isolate the signal processing from any computer accessing the data. The output of the processor is a simple ASCII data output approximately proportional to the sensor voltage and each ASCII output has a line feed. The result is a sequence of data values with a line feed, that can be stored by a storage devices such as a data logger or disk, or fed directly into a USB port of a PC, LINUX, or Mac computer.

The use of an intermediate processor is to relieve a central computer of the busy work done to put the data in a digital format and to keep the data stream as noise free as possible. The microprocessor is programmed for gain (or decimal shift), data averaging, and any pre-frequency filtering that might be applicable to the user's needs.

I am presently working with Ted Channel to try this fast 24 bit ADC system with his TC-1. This will be an ongoing project but results will be reported by Ted and by myself here on this web page. I am finding the presence of a vertical seismograph extremely helpful especially in locating large international earthquakes by time. Once a time is validated, I can much more easily locate the quake on my long period high gain Lehman, garden gate system.

In general, the 24 bit ADC system will improve resolution of a 16 bit ADC configuration by approximately 5 bits. The 5 bit resolution increase comes from the fact that 16 bits is really 15 bits if noise is considered and 24 bit is, in reality, about 20 bits allowing for noise. The net change will be about 5 bits or an improvement of  up to 32 times the sixteen bit results. In English this means that a 16 bit seismograph peak with a value in AmaSeis of 100 will show a value well over 1000 with a 24 bit system using well respected noise reduction circuit practices.

*Please note - The Arduino Uno microprocessor used in this system is one of many available. But the Arduino Board is by far the most common processor and has the most processor code available on the net written for the Arduino processor series. The Arduino is also the most common processor used by experimentalists including students of all ages - students thrive on this board. It is also one of the cheapest processors available with a street price of about $25 or less.

SYSTEM BLOCK DIAGRAM


I have shown the details of each block of this diagram later on this page. The essence of this diagram in English is as follows:

1. The seismograph generates a small voltage proportional to the movement of the detectors or sensor which is in millivolts or even microvolts.

2. The preamplifier acts as a signal booster and buffer between the seismograph signal and the 24 bit ADC input.

3. The ADC is 24 bits and can shift the decimal point of (or amplify ) the data by as much as 6 places or 1,000,000 if necessary.

4. The Microprocessor controls the ADC timing, decimal shift, signal conditioning, then outputs a digital value in ASCII to the Data logger or PC.

5. The data output can be read by any LINUX, PC, or MAC computer and converted to a value depending on the PC data display program.

This system is directly compatible with the AS-1 AmaSeis or jAmaseis screen display programs. Using some screen display systems may require adjustments in the microprocessor code for a compatible BAUD rate. The standard microprocessor code to this system is outputting at a 115,200 BAUD rate for the fastest possible data conversion at medium to high Samples Per Second rates of up to 880 CPS.

The detail of the circuit sequence can be seen on this page, below the seismograph drawing.


The Seismograph


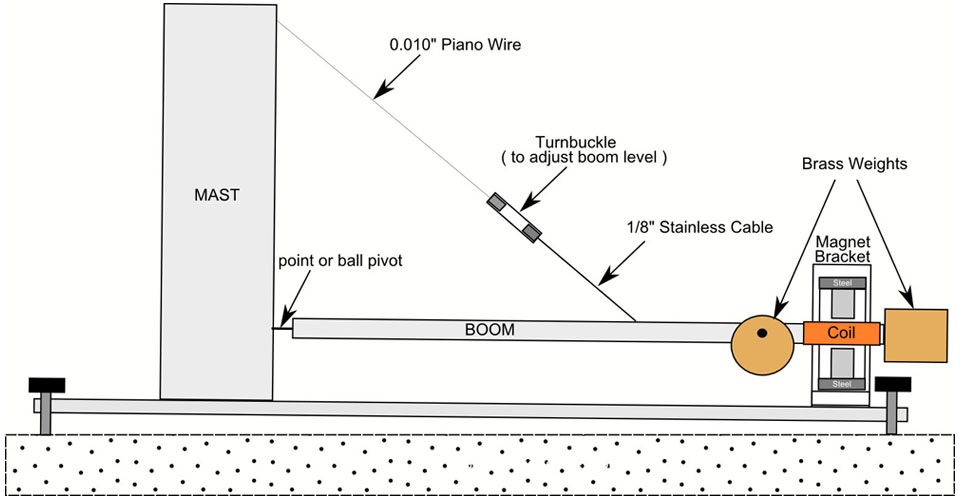
Basic Drawing

This is an experimental and development structure built to try various combinations of magnets and coils. This is not any kind of final design. The magnet and coil are placed on the boom for easy changes to the magnet or to the coil.

The Seismograph is a very simple version of the standard Lehman "garden gate" design. The updates are in the coil magnet, damper magnet assembly and the boom pivot. I am currently experimenting with a very powerful neodymium magnet set for the coil and magnetic damper. The boom is 45" long and the pivot is a very carefully chosen true tungsten carbide 0.5" square and 0.2" deep lathe insert. The boom point is a fairly sharp but softer carbide etching point. To date the pivot has shown no sign of wear and the boom assembly without the damping and coil magnets has an extremely free movement.

I timed the movement time from 1 cm off center to a near stop at the center line and the time was 47 minutes (2800) seconds. This garden gate seems to swing forever! The mast to boom cable is connected to the boom at the approximate balance point of the boom with all weights, magnets, and copper in place. This balance point is chosen to reduce excessive downward pressure on the pivot point. I will be timing this free oscillation time regularly to see if any damage is being done by the point on the boom. But at this point I am sure the tungsten carbide is so much harder than the sintered carbide point on the boom that the point is simply being rounded just as a drill bit would be rounded if I were to try to drill a hole in with a tool steel drill bit in high quality tungsten carbide.

All of the results of seismograph charts below are made with this version of the garden gate seismograph. I continue to experiment with both this sharp point pivot and a silicone nitride ball pivot joint.

The period I am using (based on the angle of the base plate) is between 15 and 30 seconds.

All construction is using aluminum plate of very heavy construction. As an example, the mast is 3" x 18" x 3/4" aluminum plate. The base plate is 4" x 5/8" x 45". The mast is bolted to the base plate with 3 heat treated 1/4-20 Allen head screws 2 inches long.

New design based on A Bob McClure design - excellent

I have just rebuilt my seismograph using Bob's 2002 design and the results to date are excellent. the basic website design is here: http://www.jclahr.com/science/psn/mcclure/horiz/horiz.html . This design is shown on JCLAHR's web site as a courtesy to Bob McClure's original work. I have gotten the basic system running but there is a lot detail work left to do such as magnet spacing and alignment.


Full sized, partially simplified, drawing of my new seismograph:

Here is a drawing with some areas simplified to show the detail of the construction of this version of my Lehman seismograph where the coil, magnet and damping are all under the boom and symmetrical about the center line of the boom. Since I am using a point suspension of the boom, balance of the boom is critical. I do use a double brass weight (not shown in the simplified drawings) near the end of the boom to fine tune the balance of the boom.  

Lehman seismograph drawing


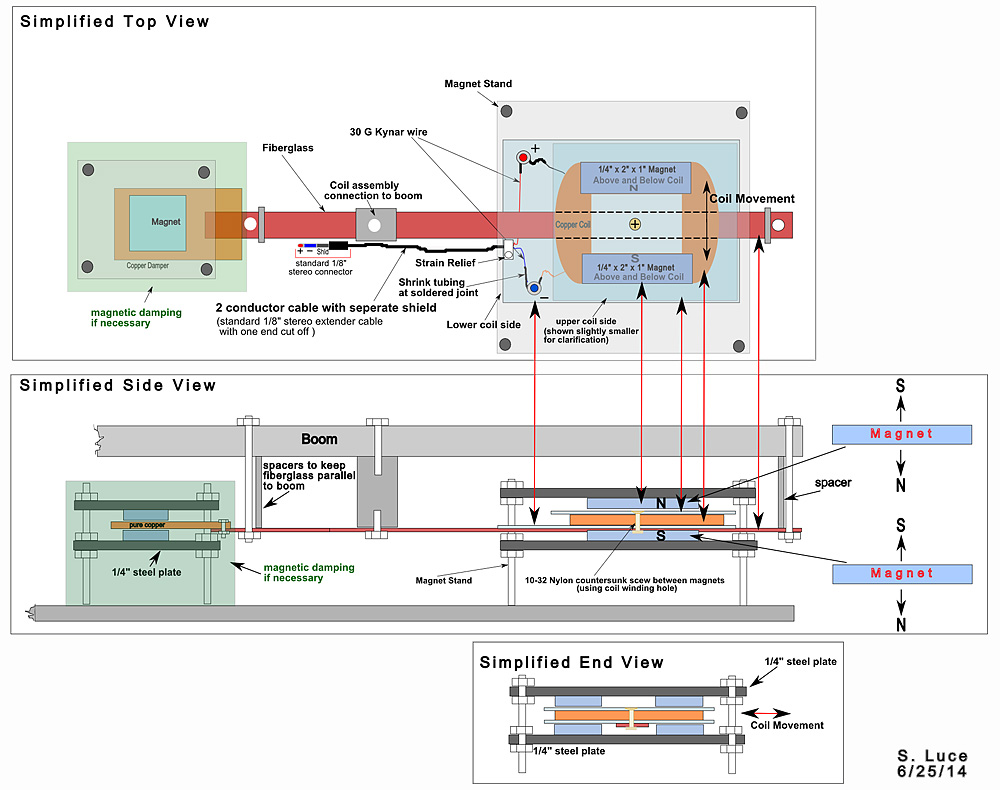
Early construction drawing with dimension detail:


The magnetic sandwich design as some call it:

Lehman design drawing
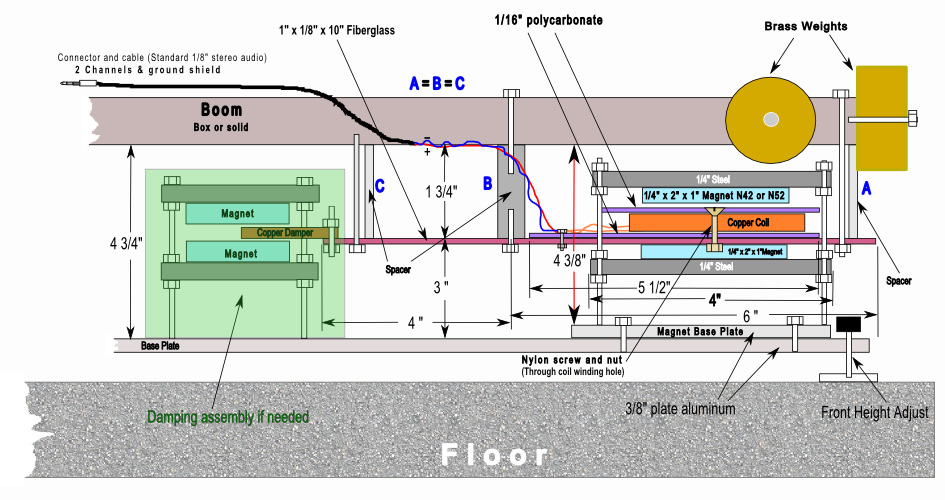
From reading my seismograph design history, this seems to be an early design originally developed by Bob McClure. My initial results using my 24 bit ADC are excellent but most of the credit goes to the mechanical design not the amplifier! The trick with this design is to squeeze the magnets as close to the rectangular coil as possible.

I used 1/16" polycarbonate plastic as the rectangular coil sides and center. Polycarbonate is strong but can be 1/16" or even thinner. The tighter the  magnet and coil the more intense the magnetic field. polycarbonate is very strong and also flexible so it does not break when holes are CAREFULLY drilled in the material. I am using a particular polycarbonate called
"makrolon" which is available at TAP Plastics by the sheet or cut to size. There is no aluminum or "stainless" anyplace in the critical magnetic field areas. The magnet stand is steel.

When the tolerances are this tight, the precision of the build of the components is critical. Any error in flatness or level will cause binding and a complete loss of a good signal.

This design seems to be as good or better than my old large coil and double high powered magnets across one part of the coil.


Coil Shunt Resistor Damping

You may wonder what happened to the damping system in my first drawing!

I am experimenting with the idea presented a few years ago which is called shunt coil damping. It is the process of finding a resistor value that can be wired in parallel with the coil in a magnet/coil design. This resistor has the ability to cause damping of the motion of the seismograph arm. Especially arms with long periods. Most commercial geophones now use this method.

The problem is finding a resistor that can do 3 things at one time:

1. damp the system to some value of one or less - this is the primary goal.
2. present a combined impedance from shunt resistor and coil that will best match the first op amp input impedance requirements.
3. that will not increase system noise and hopefully might even reduce system noise.

Accomplishing all three can not be done by mathematical analysis, as far as I know, so that simply means experimenting with resistor values that can give the best possible results of the three circuit requirements mentioned above. I also believe this damping method depends on having a lot of copper in the coil and very strong magnets.

In my reading of many well written articles on seismograph circuits, very little attention is paid to the first op amp impendence requirements. In fact I found a paper that changed the first op amp in a commercial seismograph with three different op amps and got three very different results from the commercial seismograph simply based on the variation of effects of output coil impedance and good and bad op amp input impedance requirements. The essential issue here is that very few op amp manufacturers define op amp input impedance matching methods with sources ranging from thermocouples to high impedance sensors.

I am very interested in hearing from others who have actually experimented with this process - I realize that a person's first impression would be surprise at best. One of the best ways to see this in idea action is to place the resistor in parallel with a coil in a working horizontal seismograph or geophone system and measure the period. Then remove the system magnets (if possible with a geophone) and resistor  and measure the period - there is likely to be a considerable difference!

Seismograph Examples

AN M5.1 EXAMPLE


The images below are samples from a 24 bit ADC seismograph. The image is a section of a recent event in Galeana Mexico. This event was about 1625 miles south of my seismograph. This is only a sample and the seismograph was not tuned or set up for this event. As I develop this page I will give more information on the design including the newest circuit used for this data.

The ADC is a LTC2440 capable of 7 to 880 samples per second. The setting for this seismograph below was at 7 samples per second. There is a very good reason to run at this sample rate and that is an ultra low noise level. At 7 samples per second, the ADC noise is 200 nanovolts and that low noise level significantly contributes to a very low overall noise level of the final seismograph.

A second factor is important to understand and that is the seismograph below was displayed on a dual monitor Windows 7 PC. In a dual monitor mode, and using the AmaSeis event display program, the image can be spread over both monitors at the same time making the image 1100 by 3800 with the monitors I am using. The image below is not stitched - it is a single image 1100 x 3800 pixels in size taken from a STRETCHED AmaSeis window.

As I develop this web page, I will explain more about the dual monitor system and include more on the exact construction of the seismograph including the details of the circuits and the mechanics of the seismograph.

My work with this seismograph has been with the guidance of several seismology experts and I deeply appreciate their help.

This Galeana Mexico event happened to be a good application of my seismograph because of the length of the event. I have placed the image on this site for a single and quick example of the seismograph results. Galeana Mexico is about 1625 miles south of my seismograph and in exactly the wrong orientation to my equipment. My "garden gate" is sitting north/south and is generally most sensitive to events to the east or west of my machine.

If you have questions, you can email me at Steve@steveluce.com.


Steve


                                        Seismograph Examples


 M7.2 - 36km NNW of Tecpan de Galeana, Mexico 2014-04-18 14:27:26 UTC


Print Screen from M7.2 Mexico Event from an AmaSeis screen...

FULL SIZE SEISMOGRAPH IMAGE...

This image is processed Image using the "long Period" filter by Bob McClure in the AmaSeis selection window/Control from the raw data in the image above

THIS IS A VERY WIDE IMAGE!  Please use your browser left to right slide bar at the bottom of the browser to view the full image from left to right and use your browser up/down slide bar to center the image on your screen.


M7.2 Mexico


M5.1 - 1km S of La Habra, California 2014-03-29 04:09:42 UTC

The image below is a segment of the AmaSeis Chart from 4 to 5 UTC with the La Habra event starting at approximately 4:11:09 UTC at the recording seismograph. The light red line covers the
sample taken in the next image using the AmaSeis "Extract Selection Window".

This image below is an AmaSeis "extracted view window" of the event marked above but reduced to 1200 pixels. The original 3800 pixel image. The original full size image is below this
small image.


FULL SIZE SEISMOGRAPH IMAGE...
This image below is two pages wide - 3800 pixels - please Use the browser slide bar at the bottom of this browser page to move across the full seismograph image below...


USE THE BROWSER SLIDE BAR TO VIEW THE FULL IMAGE
  left to right


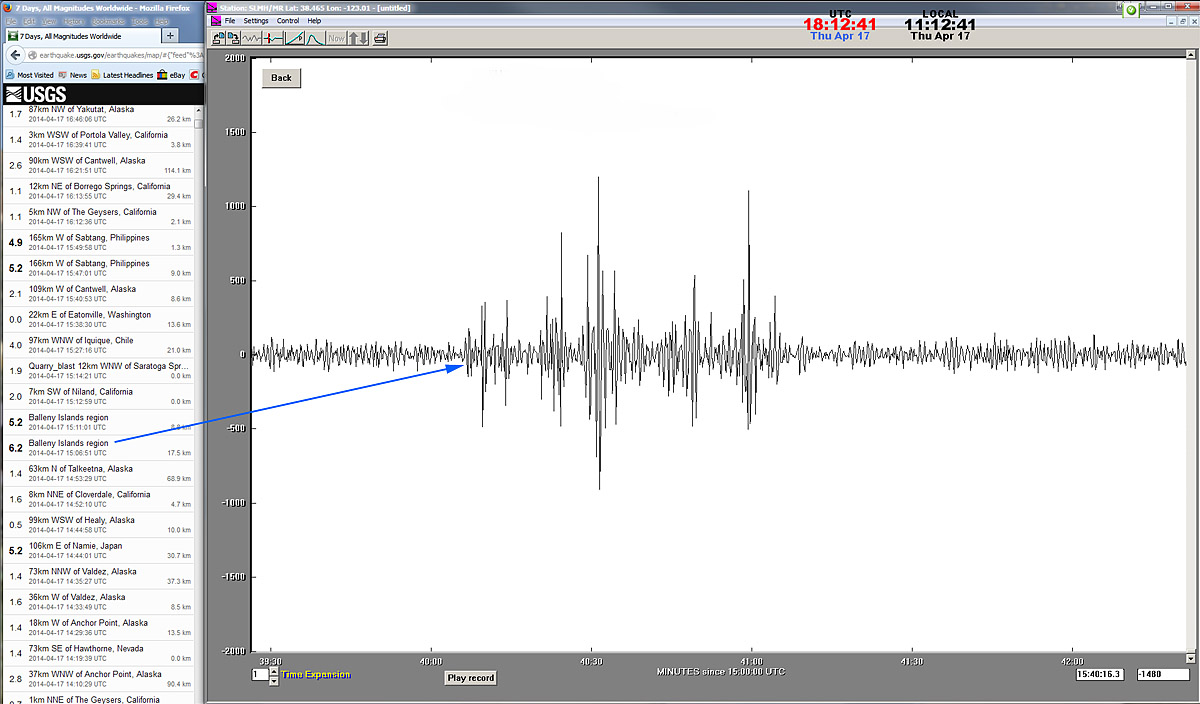
Here is a recent M6.2 a near the Balleny Islands region which is south east of Australia and about 7,300 miles from my seismograph.


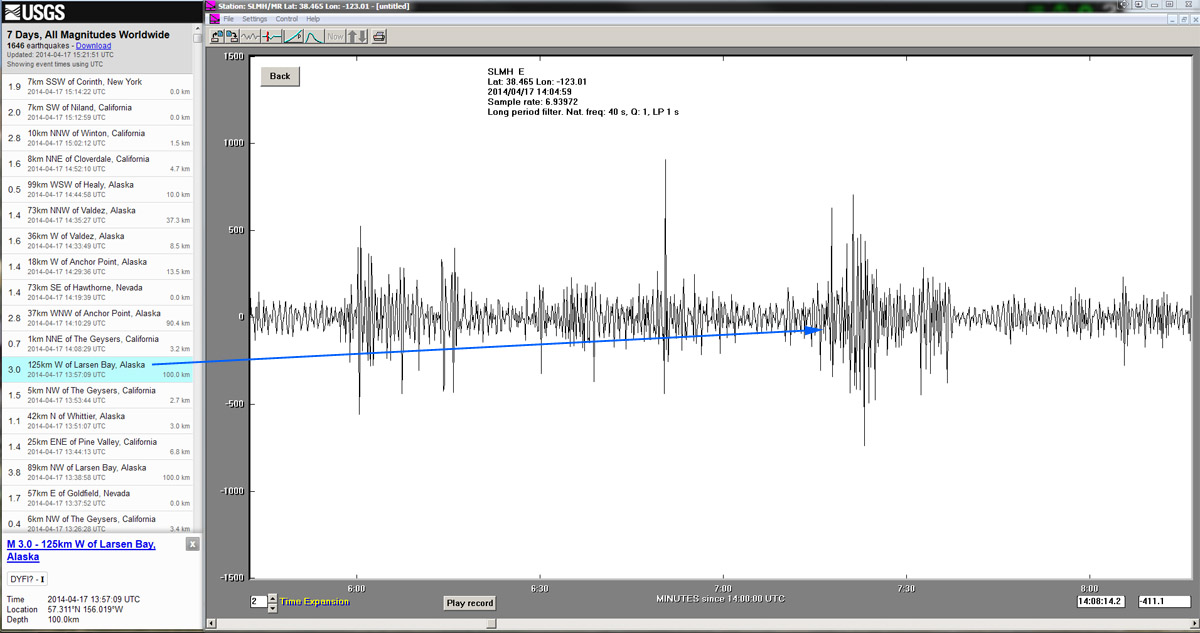
Here is a M3.0 in Larsen Bay, Alaska and about 1900 miles north west of my system.


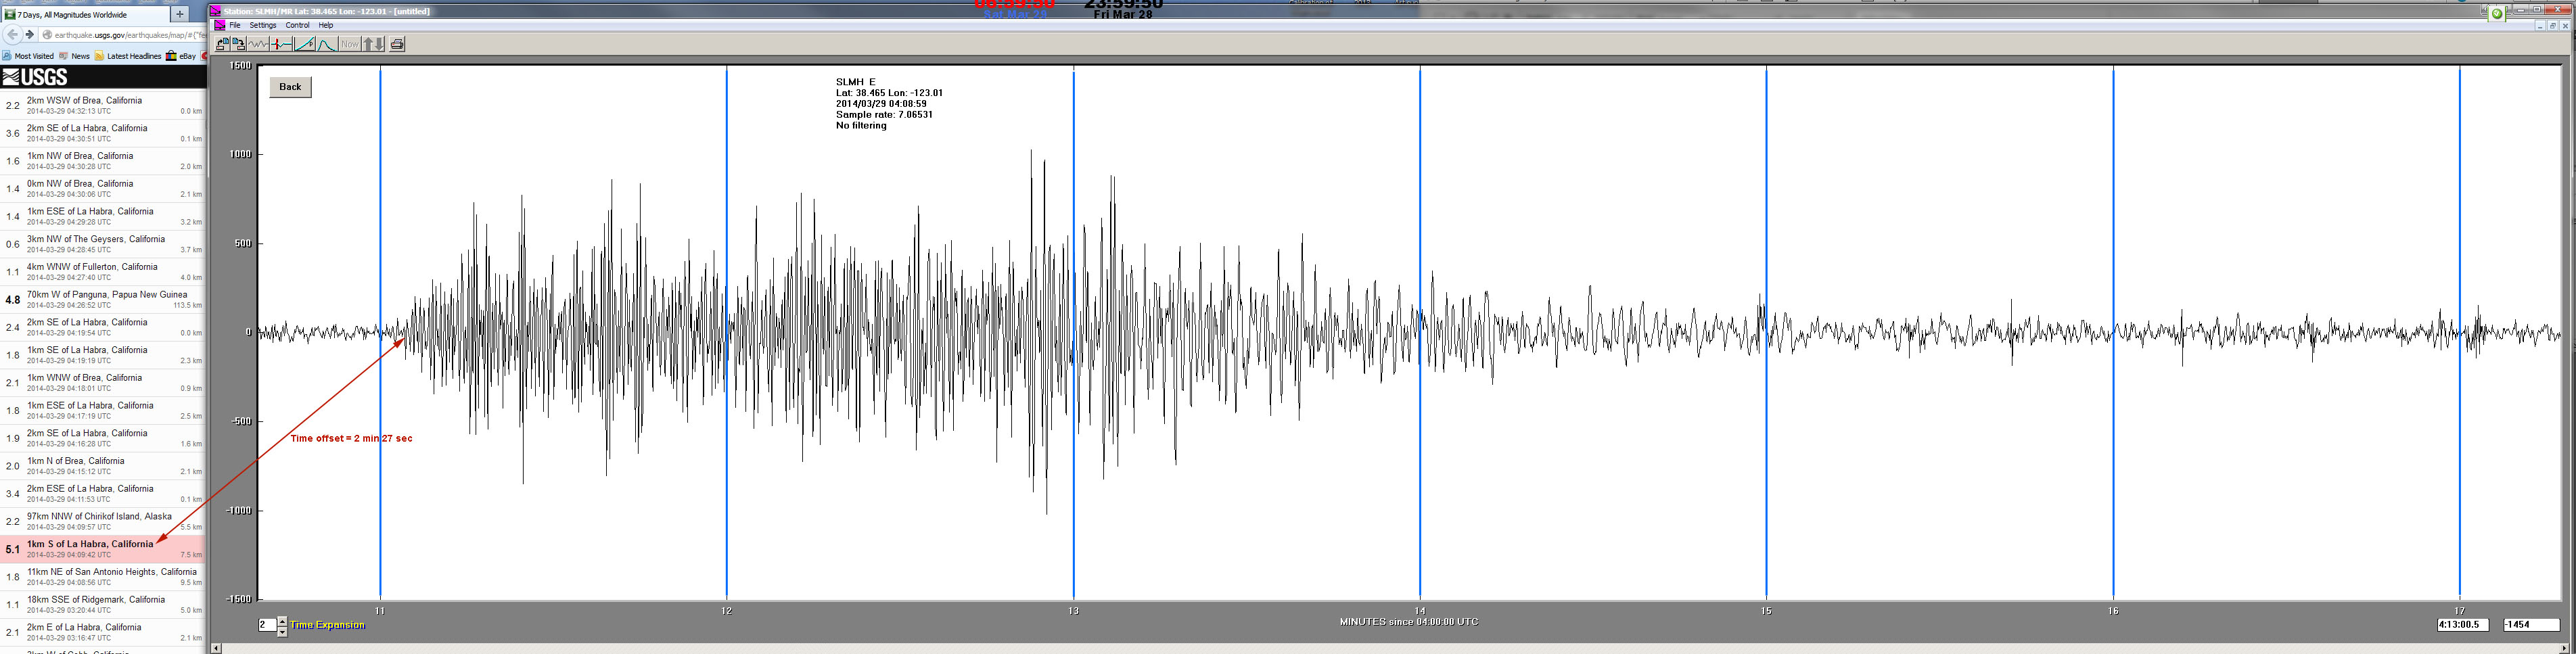
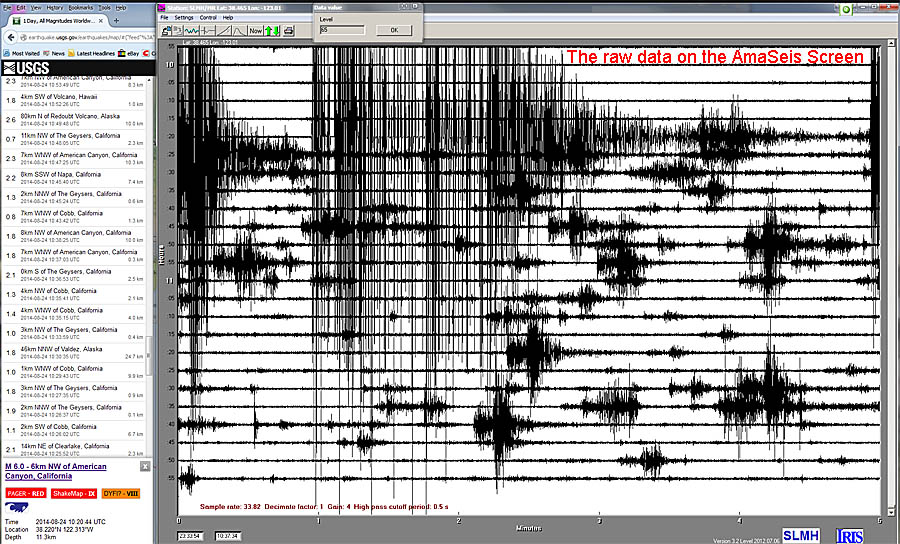
Here is a raw screen capture of an M3.6 on AmaSeis. The earthquake was in Napa Valley, about 40 miles East of my system


Additional examples of recent events including a comparison of vertical and horizontal seismographs of the same earthquake.


SEISMOGRAPH CIRCUIT

Circuit description

This is the present schematic I am using but it is very much subject to change. This is the area where the most development is concentrated
to reduce noise and produce the most efficient output to the ADC.  I generally use the ADC for a simple decimal shift. The gain is
about 100 in the op amp stages combined. I am trying to balance the noise level of the ADC and the op amps so that both contribute about the same noise to the circuit. I am trying for a noise level of less than 10 microvolts in the final output of the seismograph.

I am extremely grateful for the suggestion of James Gundersen to switch from the LTC2400 to the much faster and lower noise LTC2440 - thank you James!

I am very grateful for some assistance from John Beale with the LTC2440 in keeping the noise level to a minimum at 7 Hz or 7 samples per
second. The noise output of the ADC as shown below (with pin 7 tied low) is about 200 to 600 nanovolts.

I am using a triple voltage regulation and isolation sequence to be sure a minimum noise is introduced to the signal by the power supplies. I am also suggesting that the Arduino use the +9 VDC as a voltage source rather than the PC 5 volt supply. This prevents the Arduino board from adding noise from the PC to the ground buss of the amp/ADC electronics. A typical PC 5 volt (USB) supply is extremely noisy.

I believe there are three critical components in this system that keep the system noise to a minimum:

      1. Both the op amps and the ADC have noise levels are in the 200 nanovolt region.

      2. The low noise power supply and the three stages of regulation and isolation.

      3. An essential contribution to low noise of this circuit is the differential input to the first op amp.

The op amps are LTC1052s which are chopper stabilized, ultra low noise, and "zero drift" with temperature changes. This op amp can experience a 100 degree Fahrenheit change and the output level will be nearly impossible to see on a chart of the op amp output. This chopper stabilized amp is designed to run in a differential configuration.

The Arduino, as mentioned earlier, is used to control the ADC and to push a maximum amount of data through the system when speed is critical. The Arduino also has a gain set within the code but this better described as a decimal shift system. the decimal can be shifted as much as 6 places or the equivalent of a maximum effective gain of million. This circuit results in an approximate ADC low noise output of 20 bits. Twenty-one or even twenty-two bits can be obtained with extreme ground surface engineering on a carefully designed and shielded, low noise, printed circuit. Twenty-two bits would reduce ADC output noise by a factor of 10 over the present twenty bit output.

The output of the Arduino processor is coded to deliver an ASCII number and a linefeed. The ASCII number is roughly proportional to the sensor output voltage but greatly amplified in value.

Coil to op amp impedance matching

Probably the most complex and under rated challenge in my work with seismology and the 24 bit ADC is the input op amp (the ADC preamp area)and the process of impedance match to the source coil. I have not yet solved the problem and it seems to be an iterative process of component choices and then a lot of testing. One of the best papers I have read in my study of the input stage is this paper by Peter Rodgers. It can be found in the list of reference material listed below. Among other design problems, the paper talks about, op amp to source voltage, and impedance match problems.

Concerning the circuit below...

I am a very strong advocate of differential amplifiers and floating circuits in general. I realize referencing to earth ground works and works well most of the time but when dealing with 24 bits of data drawn from a high gain op amp, reading from a remote coil, it is my preference to float the input voltages for as long as possible just to avoid the massive ground loop problems that can occur. My background is in digital cyclotrons and linear accelerators where a measurement like beam current, usually in the nanoamp or picoamp range, is a very delicate measurement in a very noisy environment. Of course differential op amps have their own set of complex issues but I find it worth the trouble.

I also prefer multiple levels of power supply isolation and regulation. My final voltages to critical components like the op amps and the ADC come from the 5 volt, Maxim, MAX6250. My grounding practices are borderline fanatic meaning a single point ground to which all voltages are referred including the Arduino Uno power and ground. I use copper foil enclosures and guards, above, around, and under critical components. And a full copper foil cover for the final preamp/ADC circuits and all foils are grounded to the same point. This has brought my background noise with a dummy coil (no magnets) down to 10 counts RMS using AmaSeis as the measurement tool. The maximum count can be as high as +/- 100,000. One of my goals is a 10,000 to 1 S/N ratio. But I am still suffering from an op amp oscillation in the +/- 5 count range which I hope to reduce or at least understand.

I have been working on this circuit (which is, in essence, a 6 to 7 digit volt meter), for more than a year. Even last night I added a low pass filter component which I have resisted for some time. I was hoping to send pure data to the data files on which post processing could be performed but I realize low frequency noise is almost always filtered out so I finally will admit to the need to preprocess some ADC data.

I am new to seismology and just now realizing how extremely complex the science is - it is almost a place where the more I know the less I know I know - if that makes sense.


If you have questions or suggestions including any interest in the Arduino code, please email me at Steve@steveluce.com.


Please note: If you want to see more electronic detail including simplified start up schematics, working code, and a more
general application of the LTC2440 please take a look at this page:

LTC2440 APPLICATIONS, SCHEMATICS, AND CODING


Reference Material and good reading - if you are into this stuff...

This is a list of papers and sources I have found on the net that have helped me with circuit design issues.

A good paper, mentioned earlier, but excellent for op amp impedance matching, mistakes to avoid, etc...

http://bnordgren.org/seismo/Rodgerssnr.pdf 


This is a great outline by Analog Devices engineers on circuit design and layout - especially good on the subject of noise and ground planes.

http://www.analog.com/library/analogdialogue/archives/39-09/layout.pdf


A 32 page paper on ADCs and DACs...good information...good detail

http://www.dspguide.com/CH3.PDF


This is my beginning source info on the use, wiring, and code for the LTC2440, 24 bit ADC:

http://dangerousprototypes.com/forum/viewtopic.php?t=4247&p=42053


Here is the data sheet on the chopper stabilized LTC1052 op amp

http://cds.linear.com/docs/en/datasheet/1052fa.pdf


Here is the data sheet on the LTC2440 ADC

http://cds.linear.com/docs/en/datasheet/2440fd.pdf


A short basic paper on ADCs

http://www.rpi.edu/dept/ecse/rta/LMS/The_ABCs_Of_ADCs.pdf


A small paper on impedance matching of full differential op amps

http://www.ti.com/lit/an/slyt310/slyt310.pdf


A very quick article on impedance issues with op amp inputs:

http://e2e.ti.com/blogs_/archives/b/thesignal/archive/2012/05/30/taming-the-oscillating-op-amp.aspx


A good 300 page paper on seismology instrumentation - no I have not read the whole thing. Lots of basic information and math to back up each model and type.

http://www.yerdurumu.org/makaleler/documents/instrument.pdf